RELATIONSHIP OF NIFTY 50 WITH ASAHI INDIA GLASS LIMITED
AUTHOR: Akash Singh
BATCH : F3
ROLL NO: 021331025040
Introduction
Asahi India Glass Limited (AIS) is one of India’s leading integrated glass solutions companies, operating across the automotive, architectural, and industrial segments. The company’s performance is influenced by factors such as economic growth, infrastructure development, automobile demand, and real estate activity. Since these macroeconomic factors are closely linked to overall market movements, the share price of Asahi India Glass Limited tends to move in relation to broader stock market indices.
Studying the relationship between Asahi India Glass Limited and the Nifty 50 index provides valuable insights into the systematic risk associated with AIS shares and helps investors understand how sensitive the stock is to market fluctuations.
Objective
The primary objective of this study is to calculate and analyze the beta coefficient of Asahi India Glass Limited with respect to the Nifty 50 index. The study further aims to examine the statistical significance of the relationship in order to assess the systematic risk and investment suitability of AIS shares.
Literature Review
Beta Analysis and Market Risk of Indian Stocks
Existing literature identifies beta as a key measure of systematic risk, indicating the responsiveness of a stock’s returns to changes in market returns. Prior studies highlight that capital-intensive and manufacturing firms often display meaningful exposure to market movements due to demand cycles, cost structures, and macroeconomic sensitivity.
Financial Performance of Manufacturing and Infrastructure-Linked Companies in India
Research on manufacturing and infrastructure-related firms suggests that companies serving the automobile and construction sectors are influenced by economic cycles and market conditions. These firms typically exhibit moderate beta values, making beta analysis particularly relevant for evaluating stocks such as Asahi India Glass Limited.
Data Collection Methodology
· Source of Data: National Stock Exchange of India (www.nseindia.com)
· Study Period: 1 December 2024 to 30 November 2025
· Data Frequency: Weekly closing prices (Friday close)
· Number of Observations: 48 weeks
Variables Used
· Independent Variable (X): Weekly returns of Nifty 50
· Dependent Variable (Y): Weekly returns of Asahi India Glass Limited
Methodology
· Weekly returns were calculated using percentage change in prices.
· A simple linear regression model was applied using the equation:
Y=α+βX+ε
· The regression analysis was conducted to estimate beta and test its statistical significance.
Data Analysis
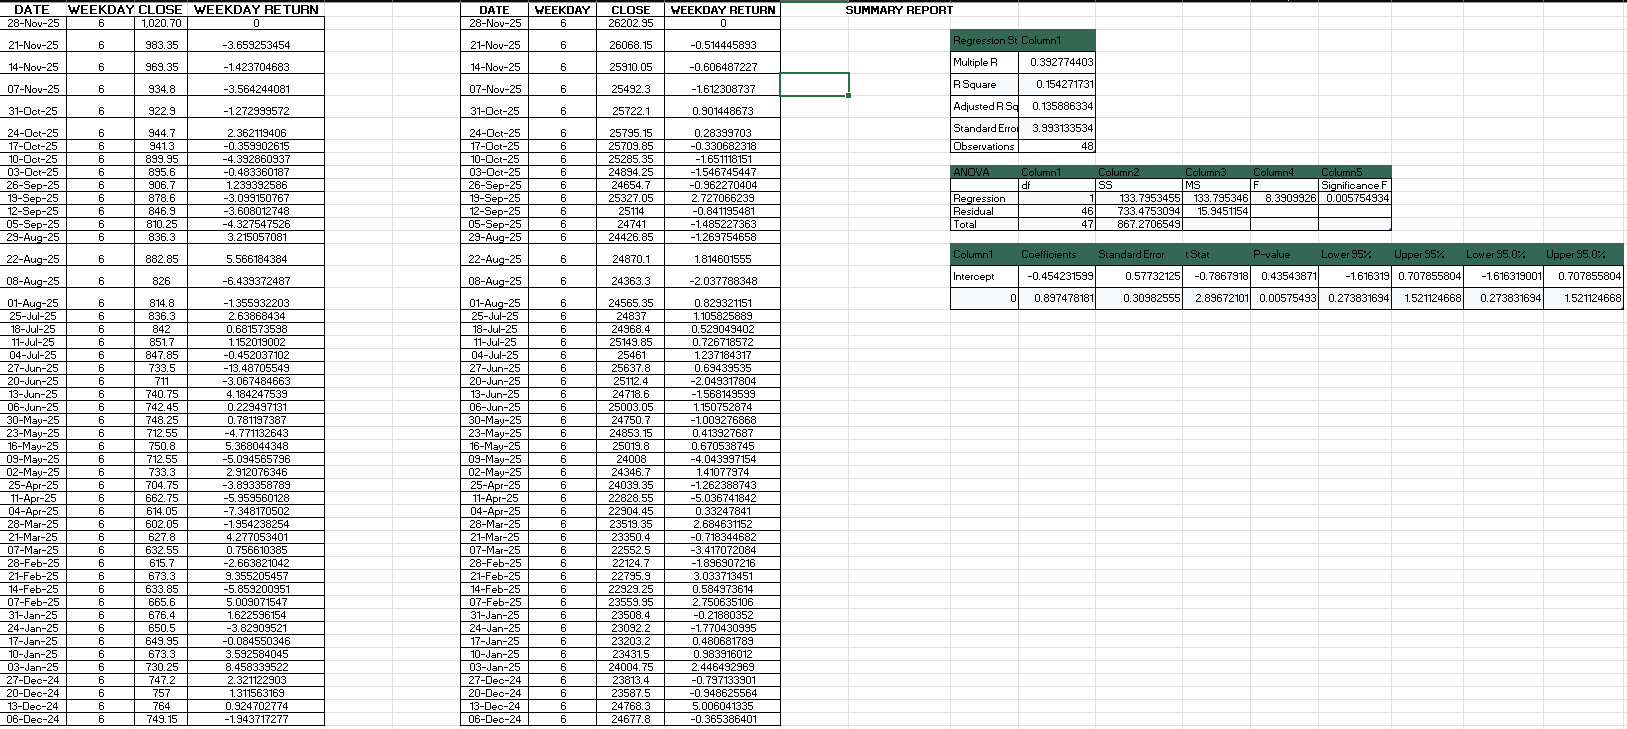
Regression Equation (Corrected)
AIS Returns=0.8975×Nifty 50 Returns-0.4542
Regression Statistics
|
Particulars |
Value |
|
Beta (Slope Coefficient) |
0.8975 |
|
Intercept (Alpha) |
-0.4542 |
|
R² |
0.1543 |
|
Adjusted R² |
0.1359 |
|
Standard Error |
3.993 |
|
t-Statistic (Beta) |
2.897 |
|
p-value (Beta) |
0.00575 |
|
F-Statistic |
8.391 |
|
Number of Observations |
48 |
Interpretation of Results
The regression analysis indicates a positive and statistically significant relationship between the weekly returns of Nifty 50 and Asahi India Glass Limited.
The beta value of 0.8975, which is less than 1, suggests that AIS is less volatile than the overall market. This implies that for every 1% movement in the Nifty 50 index, AIS returns move by approximately 0.90% in the same direction.
The t-statistic of 2.897 and p-value of 0.00575 confirm that the beta coefficient is statistically significant at the 1% significance level. Therefore, market movements have a meaningful influence on AIS returns.
The R² value of 0.1543 indicates that approximately 15.43% of the variation in AIS returns is explained by changes in the Nifty 50, while the remaining 84.57% is influenced by company-specific factors such as raw material prices, automobile demand, construction activity, operational efficiency, and management decisions.
The F-statistic of 8.391 further confirms that the overall regression model is statistically significant.
Conclusion
The study concludes that Asahi India Glass Limited has a beta of approximately 0.90, indicating that the stock is less volatile than the market index. This makes AIS a defensive stock with moderate exposure to systematic risk.
Investment Implications
· AIS is suitable for conservative and moderate-risk investors.
· The stock offers relative stability during market downturns, with smaller losses compared to the market.
· During bullish phases, AIS participates in market gains but at a lower magnitude than aggressive stocks.
· The stock is appropriate for medium- to long-term investment horizons rather than short-term speculative trading.
Overall, Asahi India Glass Limited is better suited for investors seeking lower volatility and steady returns rather than aggressive growth.
References
Patel, A. and Shah, M. (2018) Market risk and beta analysis of Indian equities, GAP Bodhitaru: A Global Journal of Humanities, 1(2), pp. 36–46.
Rao, K. and Mehta, S. (2019) Financial performance of manufacturing companies in India, International Journal of Business and Management Studies, 6(1), pp. 89–97.