TOPIC: RELATIONSHIP OF NIFTY WITH VOLTAS LTD.
AUTHOR: Vikas Shrivastav
BATCH : F3
ROLL NO: 021331025510
Voltas Limited is a leading Indian multinational company engaged in air conditioning, engineering solutions, and consumer durables. Being a part of the Tata Group, Voltas has a strong market presence and brand credibility. The company operates in sectors that are closely linked to economic growth, infrastructure development, and consumer demand. Therefore, the stock performance of Voltas Limited is influenced by overall market movements. Analyzing its relationship with the Nifty 50 helps in understanding its systematic risk.
To calculate the Beta of Voltas Limited with respect to Nifty 50 and examine its statistical significance, in order to understand the systematic risk associated with Voltas shares.
Market Risk and Beta Analysis of Indian Equities
Existing studies on beta analysis emphasize its importance as a measure of systematic risk. Research on Indian equity markets highlights that beta varies across industries depending on demand sensitivity, operating leverage, and macroeconomic exposure. Companies in consumer durables and engineering sectors generally show moderate to high beta values due to their dependence on income levels and investment cycles.
Financial Performance of Engineering and Consumer Durable Companies in India
Prior literature suggests that companies operating in consumer-centric and infrastructure-linked sectors exhibit significant sensitivity to market movements. Voltas Limited, with its exposure to both consumer durables and project-based businesses, is expected to demonstrate a meaningful relationship with benchmark indices like the Nifty 50.
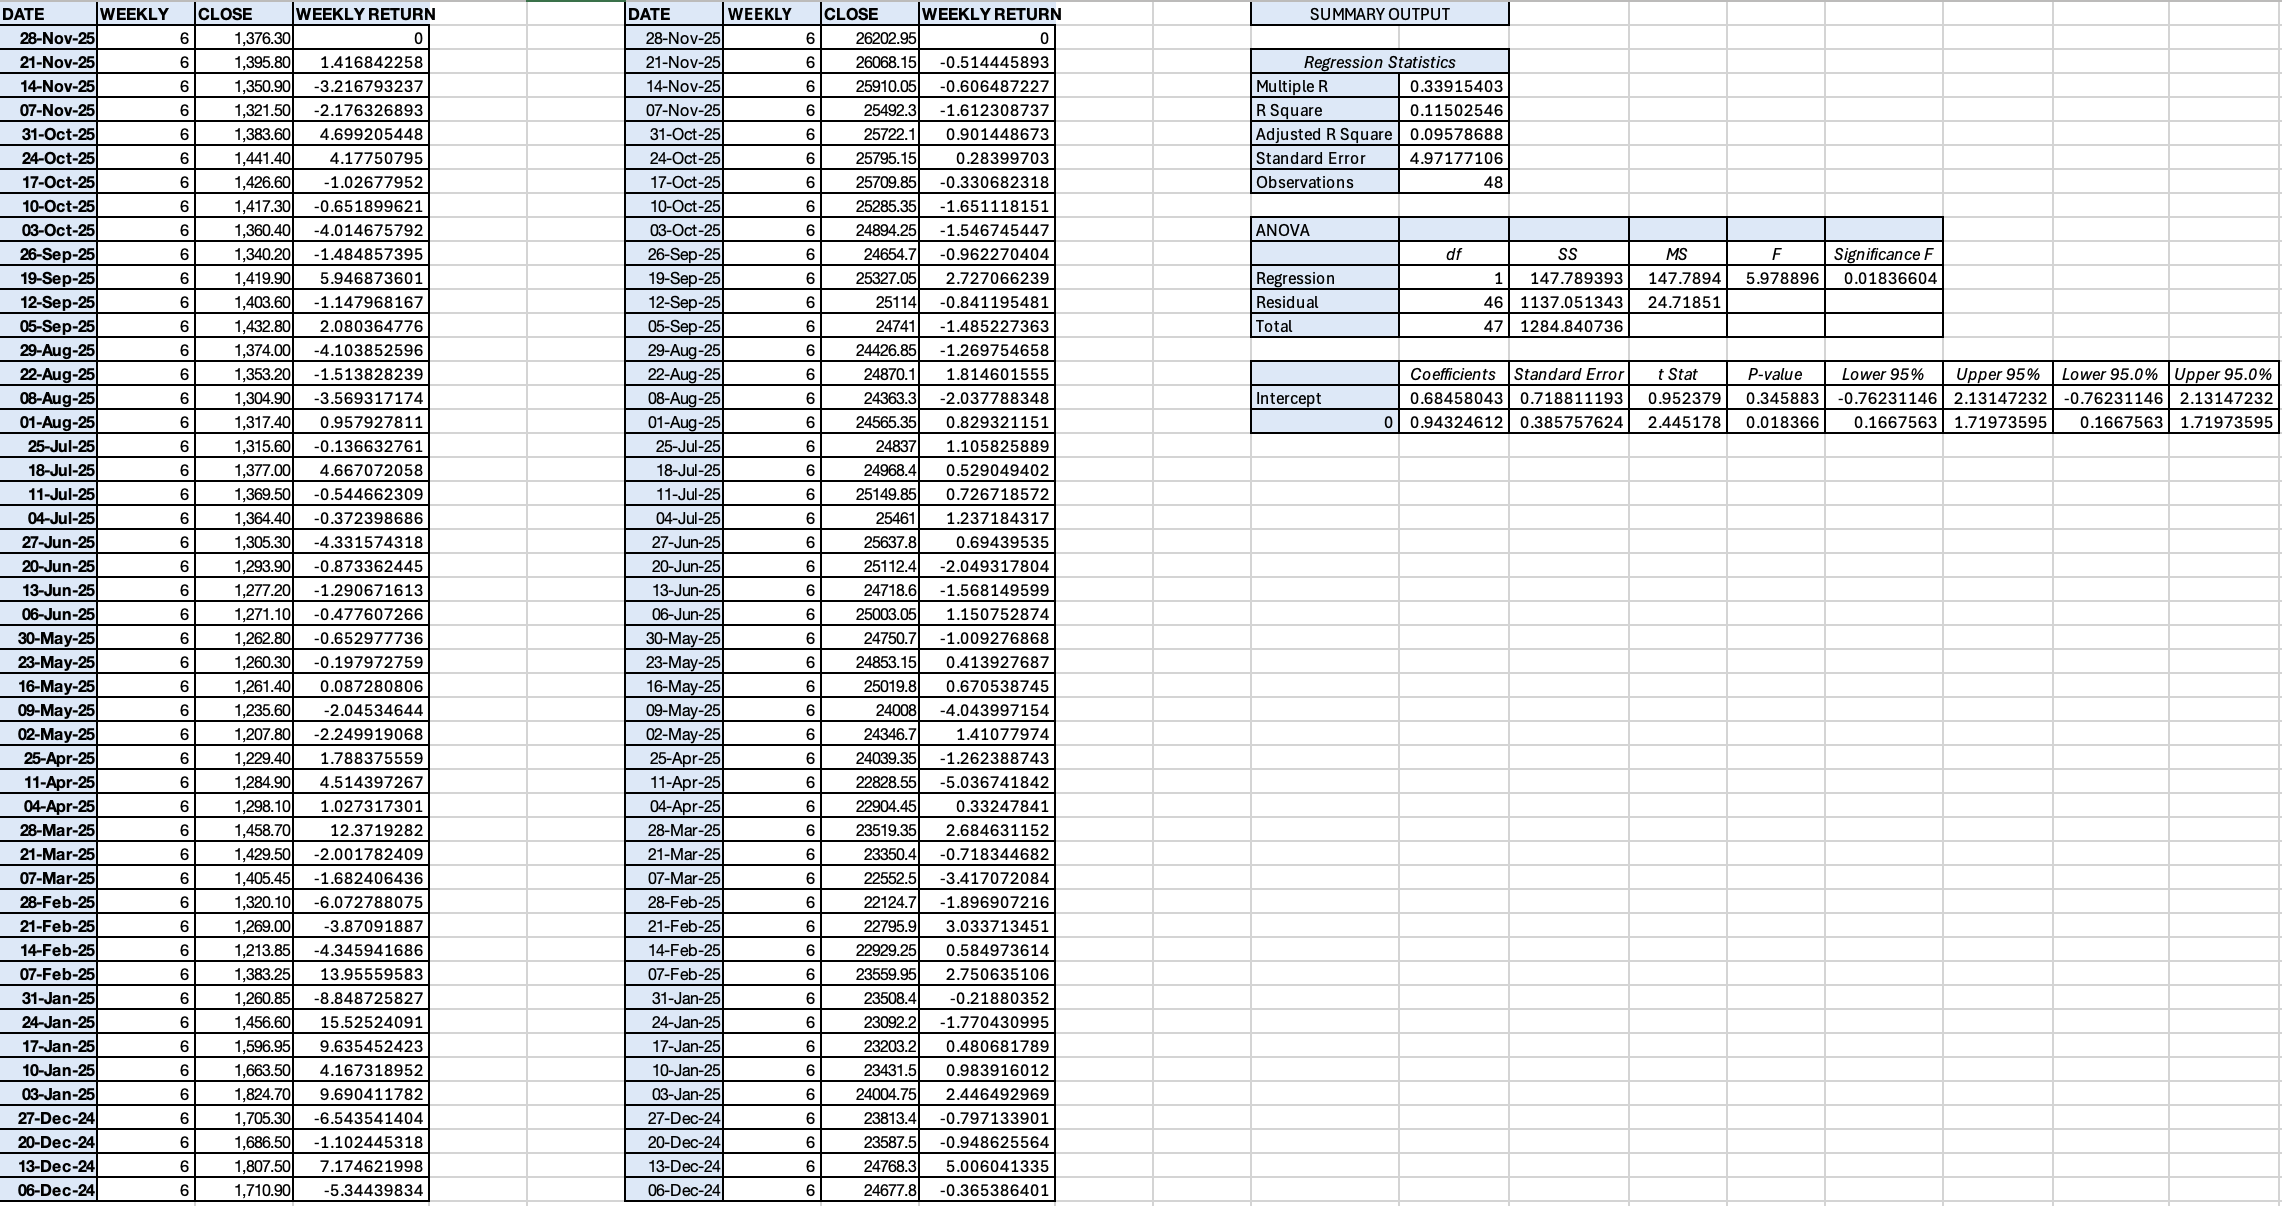
Historical data for Voltas Limited and Nifty 50 was collected from www.nseindia.com for the period 01-12-2024 to 30-11-2025. Friday closing prices were considered and weekly returns were calculated. Nifty 50 weekly returns were treated as the independent variable (X), while Voltas Limited weekly returns were treated as the dependent variable (Y). A simple linear regression was conducted by regressing Y on X using the Data Analysis Toolpak in MS Excel.
The relationship between Voltas weekly returns and Nifty 50 weekly returns is expressed as:
Regression Statistics (from Excel Analysis)
|
Statistic |
Value |
|
Beta (Slope Coefficient) |
0.9432 |
|
Intercept |
0.6846 |
|
Multiple R |
0.3392 |
|
R Square (R²) |
0.1150 |
|
Adjusted R Square |
0.0958 |
|
Standard Error |
4.9718 |
|
Number of Observations |
48 |
Table 1: Summary of Regression Statistics
|
Source |
df |
SS |
MS |
F-Statistic |
|
Regression |
1 |
147.7894 |
147.7894 |
5.9789 |
|
Residual |
46 |
1137.0513 |
24.7185 |
|
|
Total |
47 |
1284.8407 |
|
|
Table 2: ANOVA Results (Significance F = 0.0184)
|
Coefficient |
Value |
Std. Error |
t-Stat |
p-value |
|
Intercept |
0.6846 |
0.7188 |
0.9524 |
0.3459 |
|
Beta (Slope) |
0.9432 |
0.3858 |
2.4452 |
0.0184 |
Table 3: Coefficient Analysis
The regression analysis reveals the following key findings:
Beta Coefficient (0.9432): The beta value indicates that Voltas Limited moves almost in tandem with the market. For every 1% change in the Nifty 50 returns, Voltas Limited returns change by approximately 0.9432%, suggesting that Voltas is slightly less volatile than the overall market.
Statistical Significance: The t-statistic of 2.4452 with a p-value of 0.0184 (less than 0.05) confirms that the beta coefficient is statistically significant at the 5% significance level. This indicates that market movements have a reliable and significant influence on Voltas’ stock returns.
R² Value (0.1150): The R-squared value of 0.1150 suggests that approximately 11.50% of the variation in Voltas’ weekly returns is explained by changes in the Nifty 50 index. The remaining 88.50% of the variation is attributable to firm-specific factors such as seasonal demand patterns, raw material price fluctuations, competitive pressures, management efficiency, dividend announcements, and company-specific news.
Model Significance: The F-statistic of 5.9789 with a significance value of 0.0184 indicates that the overall regression model is statistically significant, confirming that the relationship between Nifty 50 and Voltas returns is reliable and not due to random chance.
Intercept (0.6846): The positive intercept suggests a baseline weekly return of approximately 0.6846% for Voltas, independent of market movements. However, with a p-value of 0.3459, this intercept is not statistically significant.
Based on the regression analysis, the following conclusions can be drawn:
1. Beta Value of 0.9432: Voltas Limited has a beta of approximately 0.9432, which is less than 1. This indicates that the stock is moderately less volatile than the overall market.
2. Return Characteristics: Voltas tends to provide relatively stable returns compared to the Nifty 50 index. The company may underperform slightly during strong bullish phases but offers some downside protection during bearish market conditions.
3. Investment Suitability: Given its moderate beta and systematic risk characteristics, Voltas is suitable for investors with moderate risk appetite who seek stability in their portfolio.
4. Strategic Implications: The stock is appropriate for long-term investment strategies focused on stability and steady growth, particularly for risk-averse investors who value capital preservation alongside capital appreciation.
[1] Sharpe, W.F. (1964) ‘Capital asset prices: A theory of market equilibrium under conditions of risk’, Journal of Finance, 19(3), pp. 425–442.
[2] Gupta, R. and Kaur, M. (2017) ‘A study of systematic risk of selected Indian companies’, International Journal of Financial Management, 7(2), pp. 15–24.