TITLE
A Comparative Study of Customer Preference Towards Selected Listed Companies Using
ANOVA
Author Name: Vedant Agrawal
Course: MBA
1. OBJECTIVES OF THE STUDY
● To analyse customer preference levels towards selected fast food brands.
● To compare customer ratings across the selected corporate entities.
● To identify whether a significant difference exists in customer preference among the selected brands.
● To apply ANOVA as a statistical tool for analysing customer preference.
2. LITERATURE REVIEW
Source of
Variation SS df MS F P-value F crit
Rows
(Responden 117.994 39 3.025 3.053 0.000002 1.503
Previous studies on consumer behaviour reveal that taste, pricing, service quality, and brand image significantly influence customer preference. Researchers have found that strong brand perception and consistent product quality lead to higher customer preference and repeat purchase behaviour. Several empirical studies have applied Analysis of Variance (ANOVA) to identify significant differences in mean preference scores among brands, making it an effective technique for comparative consumer research.
3. HYPOTHESIS
● Null Hypothesis (H_0): There is no significant difference in customer preference among the selected companies.
● Alternative Hypothesis (H_1): There is a significant difference in customer preference among the selected companies.
4. DATA COLLECTION
● The study is based on primary data collected through a structured questionnaire.
● A total of 40 respondents participated in the survey.
● Respondents rated their preference for the companies on a 1–10 rating scale, where 1 indicates very low preference and 10 indicates very high preference.
● Equal observations were maintained for each brand to ensure balanced ANOVA analysis.
5. DATA ANALYSIS
Analysis of Variance (ANOVA) was applied to examine differences in customer preference among the selected companies.Based on the provided data table:
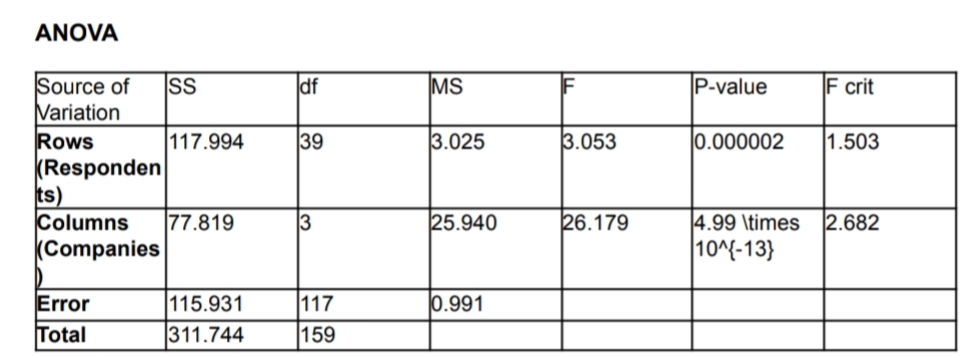
Findings:
● The F-value for companies (26.179) is significantly greater than the F-critical value (2.682).
● The p-value (4.99 times 10^{-13}) is much less than the 0.05 significance level.
● This indicates a statistically significant difference in customer preference among the companies.
● Consequently, the null hypothesis is rejected, and the alternative hypothesis is accepted.
6. CONCLUSION
The study concludes that customer preference differs significantly among the selected companies. This suggests that consumers perceive these brands differently based on factors such as quality and brand image. These findings provide useful insights for companies to improve customer satisfaction and strengthen their competitive position. The study is limited by sample size, and future research may include a larger sample and additional variables. Would you like me to create the government financial infographic based on these results as we discussed previously?